PEPPER Web Interface: Backend and Frontend Server API
Author: Lucian Nita (RomSoft)
1 Introduction
The purpose of this document is to explain the intended use and functionality of the PEPPER Web Interface tool (PWI).
The PWI is a web tool that allows the users to create accounts, adding medical data for each account and then access pages for data displaying and analysing.
Even though the application can be used for the analysis of medical data in general, however, most of the functionalities implemented in PWI are dedicated to diabetic patients.
The PWI application is connected to other APIs developed into Pepper project context (Safety System API, Case Base Reasoning API) that helps the diabetic patient improve the treatment disease.
2 System Architecture
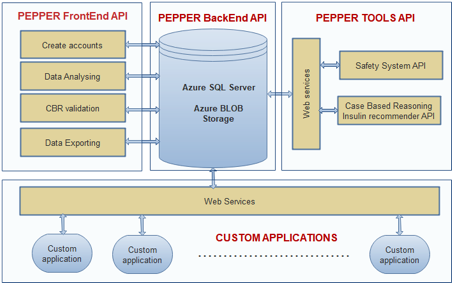
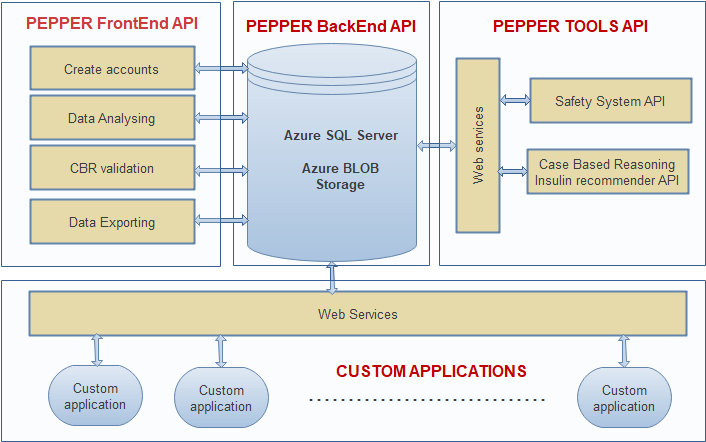
The PWI architecture is given in Fig.1.
There are four main components that build together the PWI application:
- PEPPER Backend API: represents the system database. This component stores all data related to the patient: patient profile, blood glucose values, physical activities, meals, insulin injections etc.
- PEPPER TOOLS API: the database is connected to other
Pepper API tools that add functionalities to the PWI
application:
- Safety System API: this API communicates with the database through web services using standardized JSON objects. The objects format are detailed into the API chapter. The PWI applications reads those objects and displays the CGM values included into the objects helping the user to analyse the entire context for a given critical case.
- Case Base Reasoning API: this tool sends CaseBase Objects (CBO) into database. These cases are not passed yet the Revise and Retain steps from the Case Base Reasoning (CBR) algorithm.
- PEPPER Frontend API: represents the user interface
for this application, includes the following main
modules:
- Creates accounts: each user is free to create an account in order to save and analyse data.
- Data Analysing: pages that display patient data and build statistics related to diabetic patients (hypo/hyperglycaemia events, mean value etc.).
- CBR validation: pages that integrate the revise and retain steps for CBR algorithm.
- Data exporting: instruments that export data into several formats in order to be processed by other tools (Matlab, Excel etc).
- Custom Applications: developers from the world can create their own applications that connect to Pepper database and then use the PWI instruments in order to analyse the data and improve the diabetic patient treatment.
3 Instructions for Use
3.1 Getting Started
To start the PWI, navigate to
http://82.77.27.56:61000/ in your web
browser. Once you have navigated to the website, login
using the credentials you should have been issued with.
3.2 Language
The preferred language can be selected by clicking on the appropriate flag in the top right of the interface. This option is available on pages.
3.3 PWI Navigation
The user has four main sections accessible from the navigation menu once logged in:
- Patients
- Patient Registration
- Patient Overview
- Case-base
- Safety System Objects
- Notes
- Alarms
3.4 Patients
Intended use: To enrol patients on the study and register their profile. Additionally, allows editing and removal of patients on the study.
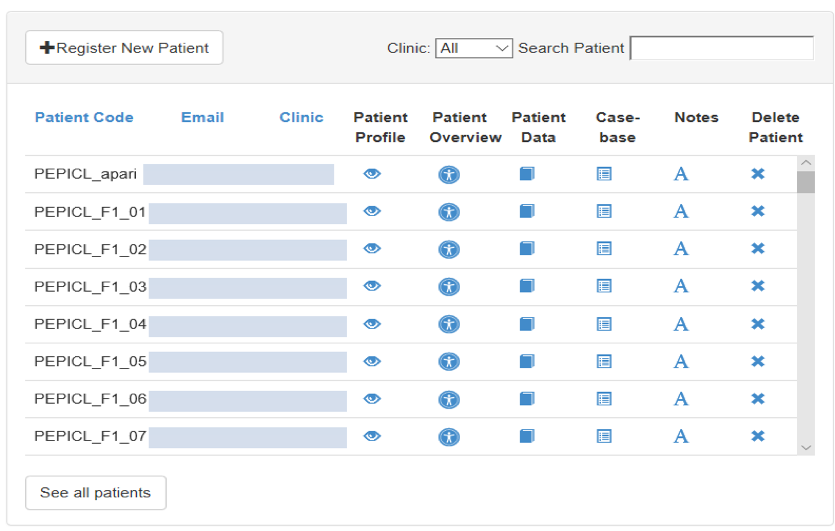
3.4.1 List of Patients
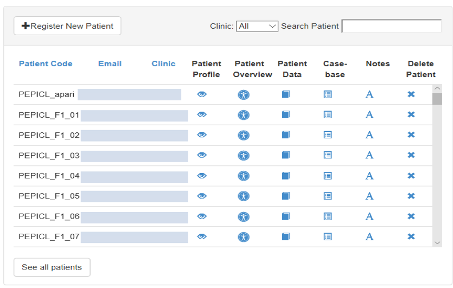
The list of patients’ page serves as the home screen for patient management, allowing clinicians to register new patients.
The list of patients is both searchable and sortable. Patients can be edited and delete (with confirmation) from this page using the corresponding buttons on the right hand side.
Patients are listed only by their unique identification number as no identifiable information is held on the PEPPER Server Application.
From this interface, you can navigate the following options for each of the patients:
- Profile – Details about the patient
- Edit Profile – Edit details about the patient
- Overview – See the patient’s data for analysis
- Delete – Remove a patient from PEPPER
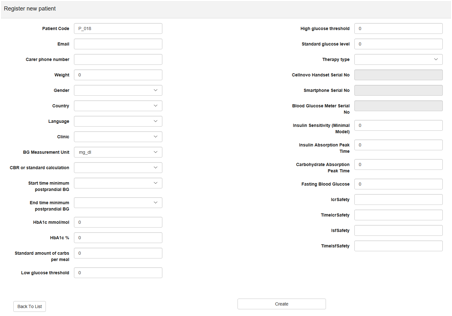
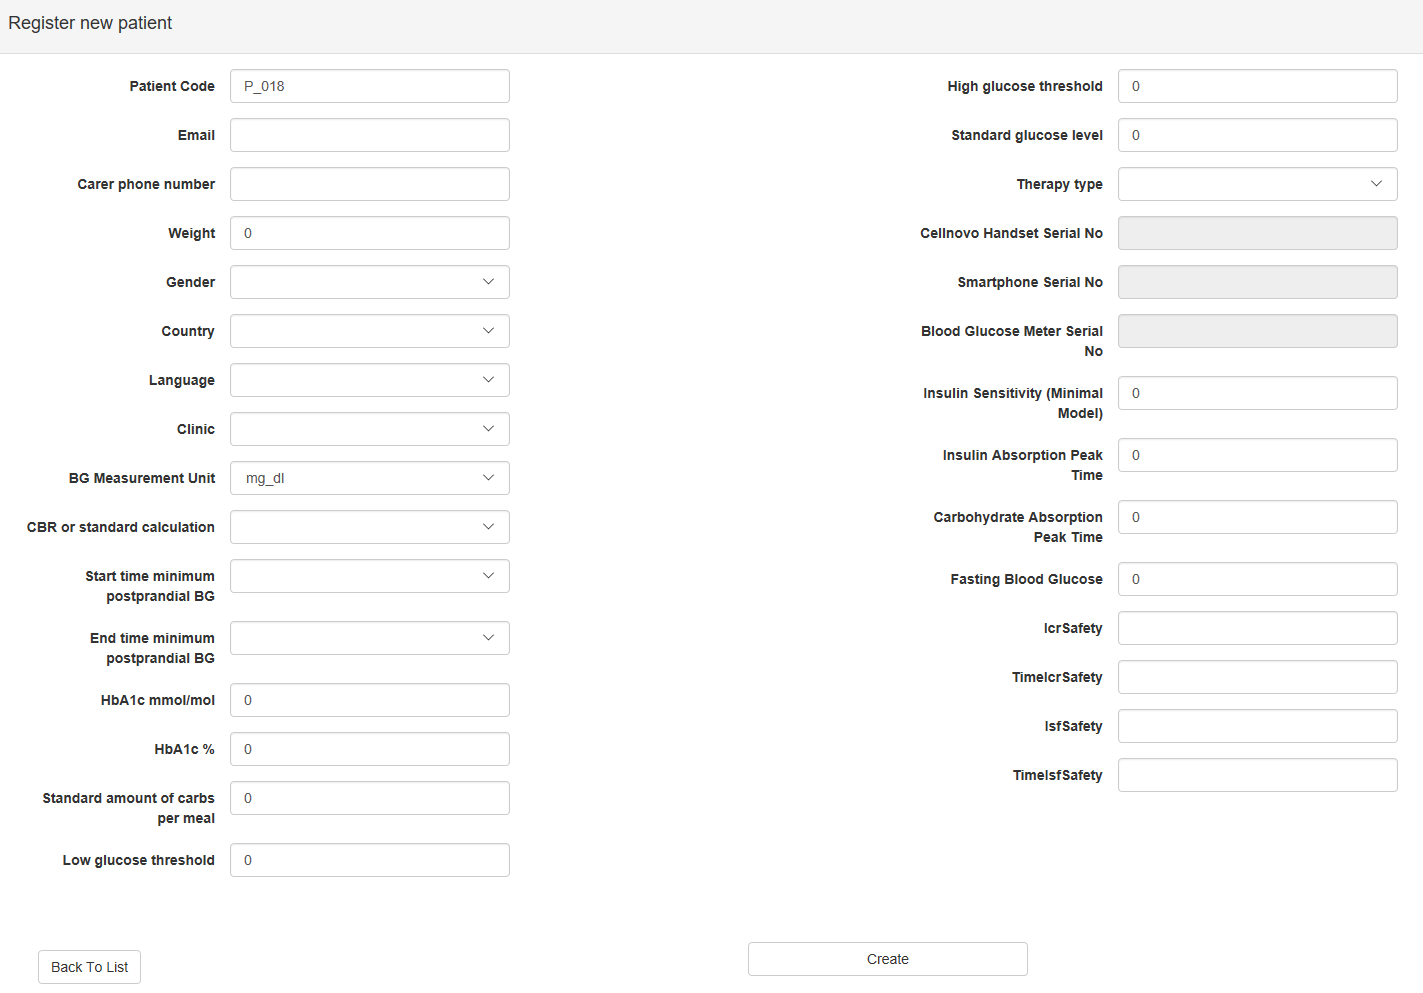
3.4.2 Register New Patient
Intended use: To register and setup patients for the clinician study.
Navigate to the Register new patient button at the top left of the Patients interface.
Patient registration allows clinicians to enrol users on the PEPPER study. The patient registration requires the clinician to input the patient details and then complete the patient’s ICR and ISF profile.
Important: The patient should be registered anonymously to ensure that no identifiable information exits the control of those involved in the clinical trial.
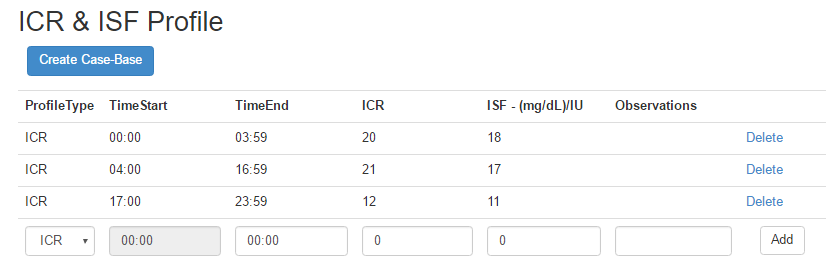
Create the initial CaseBase object for a new patient
When a new patient is registered, then the PWI should create the first CaseBase object for that patient. This object is created based on the ICR and ISF profiles that the clinician should complete for this patient. The ISF and ICR inputs (Figure 4) must cover the entire 24-hours a day, if not, the application raises errors during creation of the patient’s case-base files. These files are created by clicking the “Create Case-Base” button and represent the first Case base population for that new patient. This population is sent to database and is used by the CBR algorithm as start point for that patient.
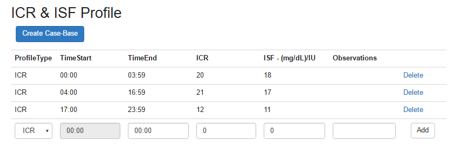
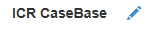
If an error occurs during the Case-Base saving, then the clinician could retry again by clicking the “ICR CaseBase” icon from the Patient Details page.
Fill the ICR and ISF patient profiles for the Safety System
The Safety System algorithm needs also the ICR and ISF tables for the patient, but these tables could be different from the profile inserted on CaseBase page. For this purpose, the clinician could insert directly the time and profile strings on the patient fields by respecting the order and number of intervals for each pair of values, for example:
"IcrSafety":"19.16,19.1,19.1" "TimeIcrSafety":"0,11,17"
or can be built in a more secure manner by using a table editor from the Patient Details page and clicking on the Pencil icon:
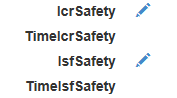
These strings are saved on Patient object and sent to backend database.
3.4.3 Patient Overview
Intended use: Visualise patient data to aid communication and allow electronic input of the clinic results.
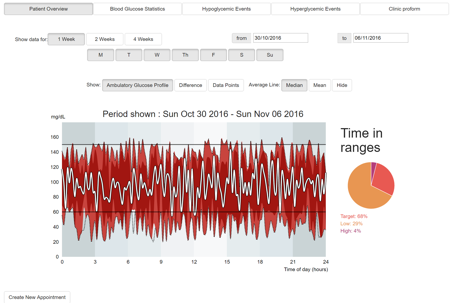
3.4.3.1 Patient Overview Main
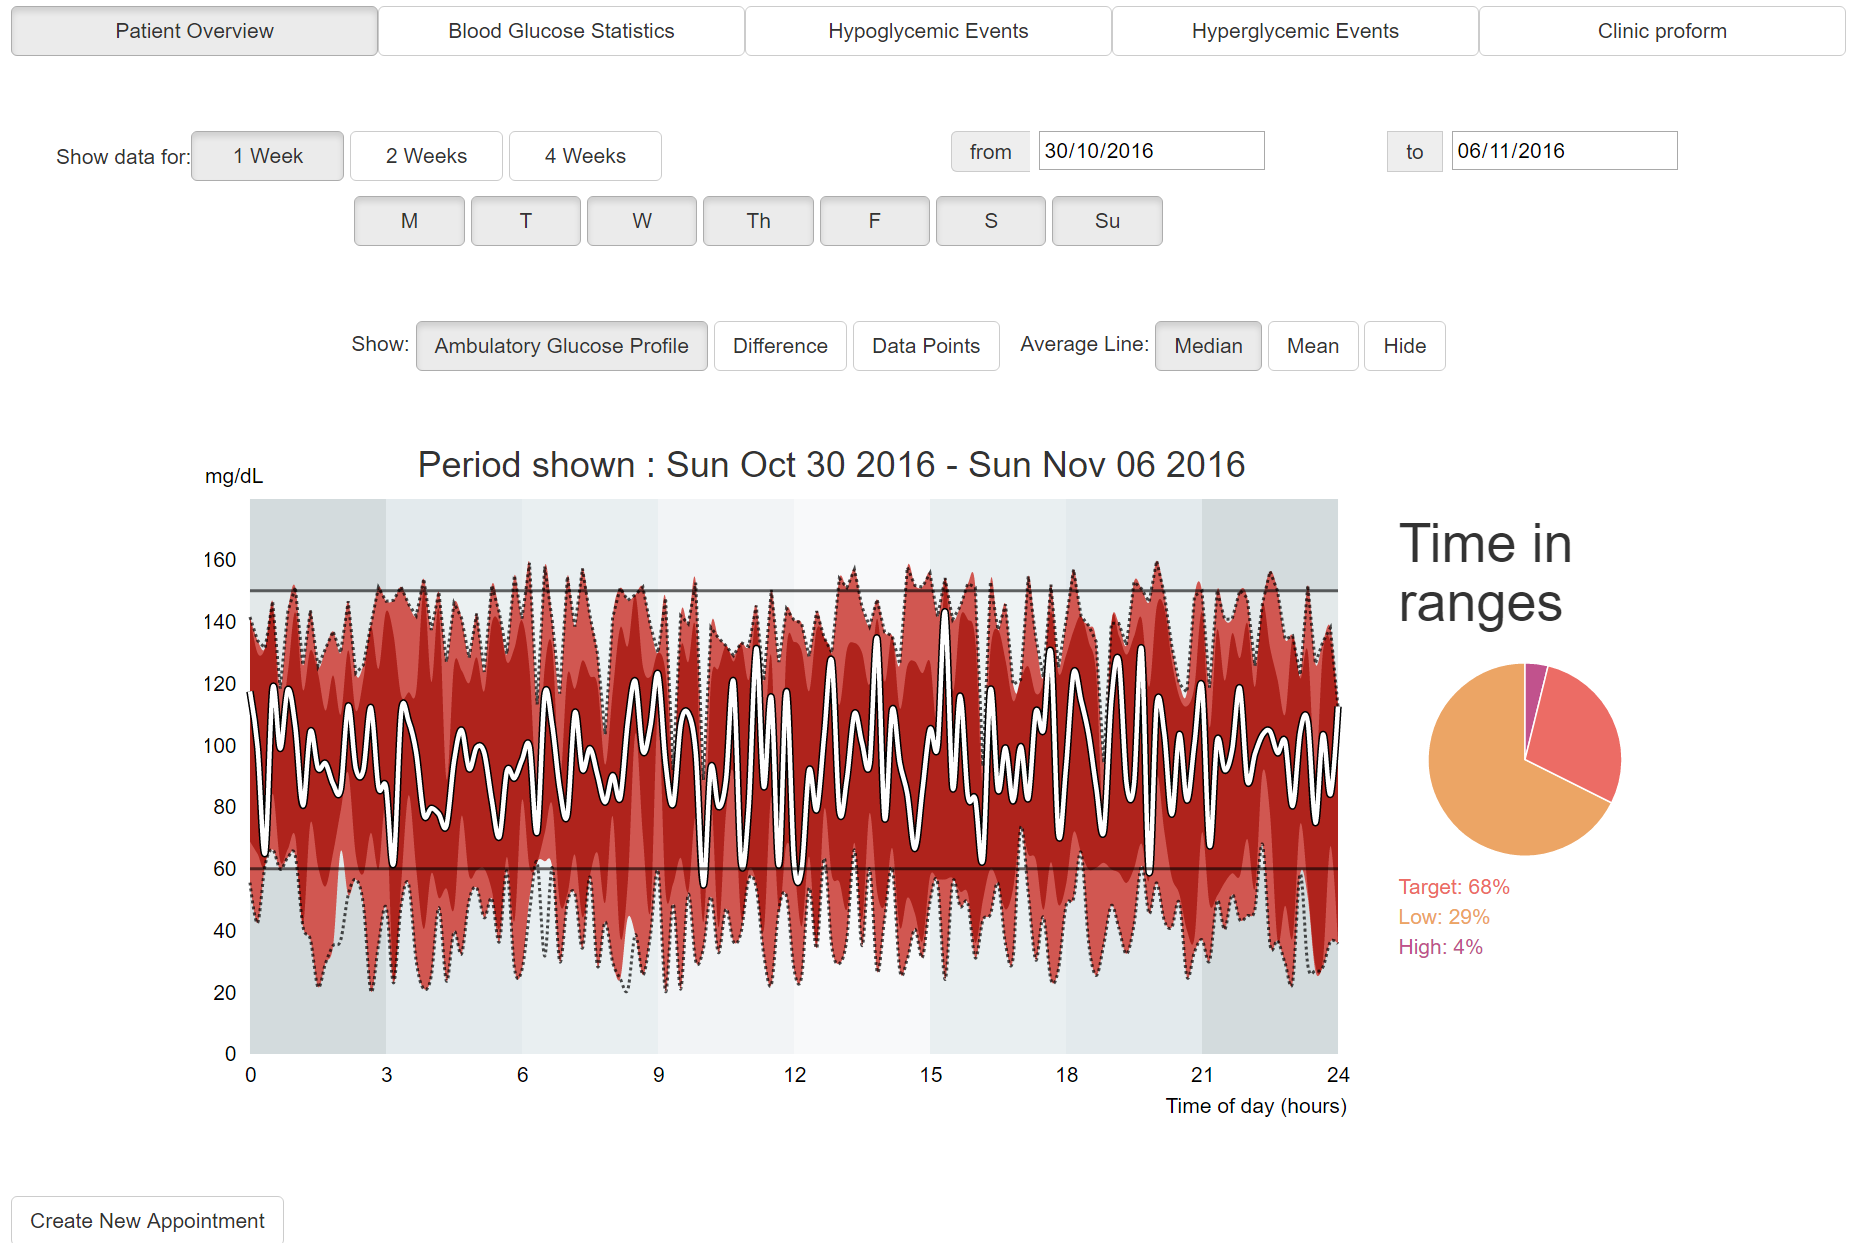
The main patient overview interface (Figure 7) is the first page displayed once selecting a patient. This page contains an overview of the patients CGM data for a selected period of time.
At the top of the page are date pickers for the period be displayed, by default this is the last week from the current date
The main data shown on this interface is an interactive graph showing the CGM data of the current period using a 24-hour window to aggregate the data.
The presentation and range of the data can be changed by using the following filters/options:
- Show data for: 1, 2 or 4 weeks. Alternatively input a custom date range using the date pickers (Default: 1 week).
- Filter the days shown: Click the days Monday (M), Tuesday (T), Wednesday (W), Thursday (Th), Friday (F), Saturday (S), Sunday (Su) to limit what days the data should be shown for (Default: all days are shown).
- Show: Ambulatory Glucose Profile, Difference or Data Points, changes the visual representation of the data (Default: Ambulatory Glucose Profile).
- Average line: Median, Mean or Hide, changes the average trend line shown on the graph (Default: Median).
Beside the main chart is a pie chart visualising the percentage of time spent in range, high or low to provide a quick summary of time in ranges for the selected period.
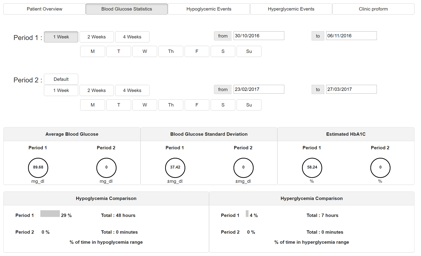
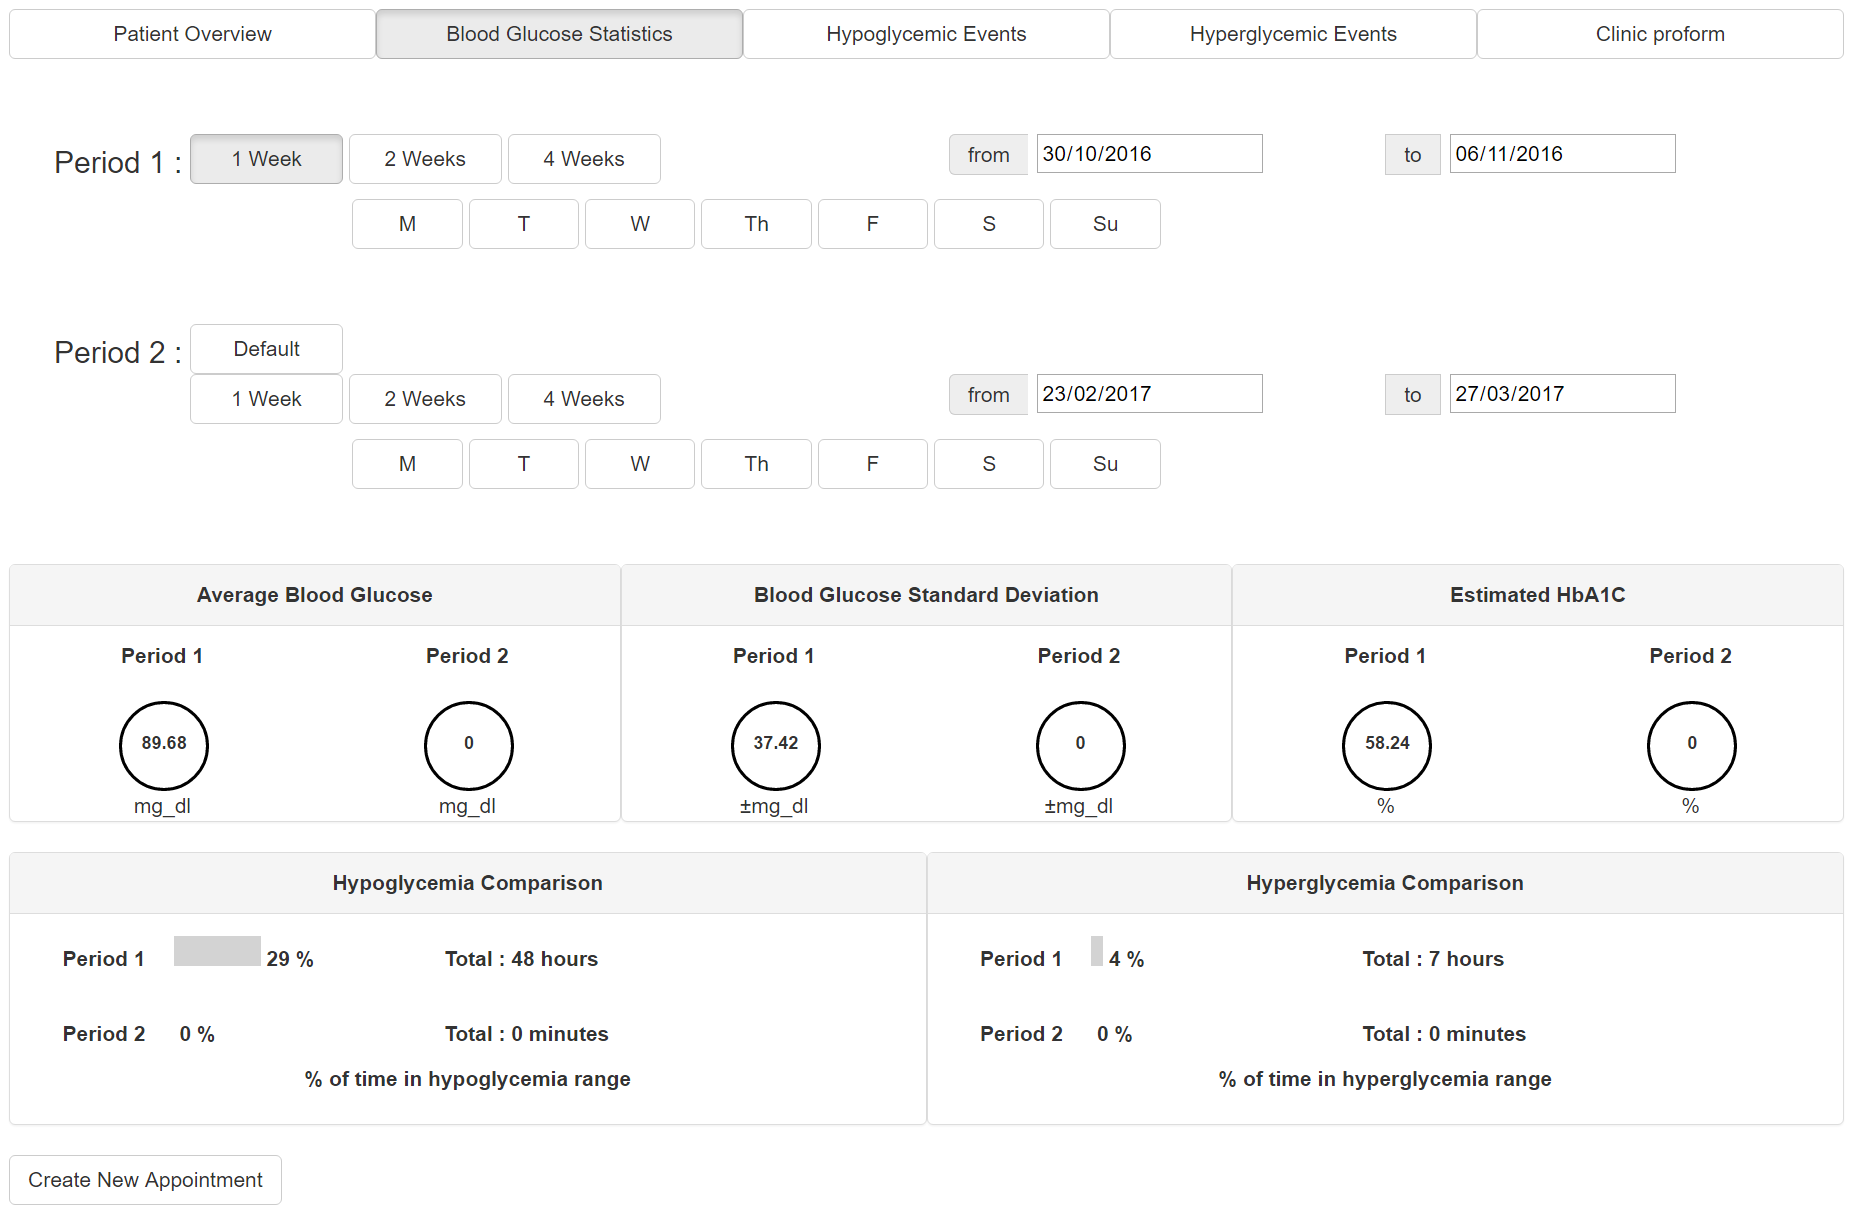
3.4.3.2 Blood Glucose Statistics
Intended use: To explore and compare blood glucose related statistics from different time periods, allowing changes of therapy to be analysed.
The blood glucose statistics interface displays the following information, allowing comparison between two selected time periods, called Period 1 and Period 2:
- Average blood glucose level for the period
- Standard deviation of blood glucose for the period
- Estimated HbA1c for the period
- Hypoglycaemic events for the period
- Hyperglycaemic events for the period
The range of the data for either of the two periods can be changed by using the following filters:
- Show data for: 1, 2 or 4 weeks. Alternatively input a custom date range using the date pickers (Default: 1 week).
- Filter the days shown: Click the days Monday (M), Tuesday (T), Wednesday (W), Thursday (Th), Friday (F), Saturday (S), Sunday (Su) to limit what days the data should be shown for (Default: all days are shown).
By default, Period 2 ‘mirrors’ Period 1, showing the data for an equivalent period of time prior to the Period selected for Period 1. For example, if Period 1 is set to show data for 1 week from the current data, Period 2 will show data for 1 week starting from a week prior to the current date.
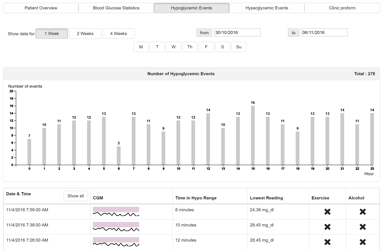
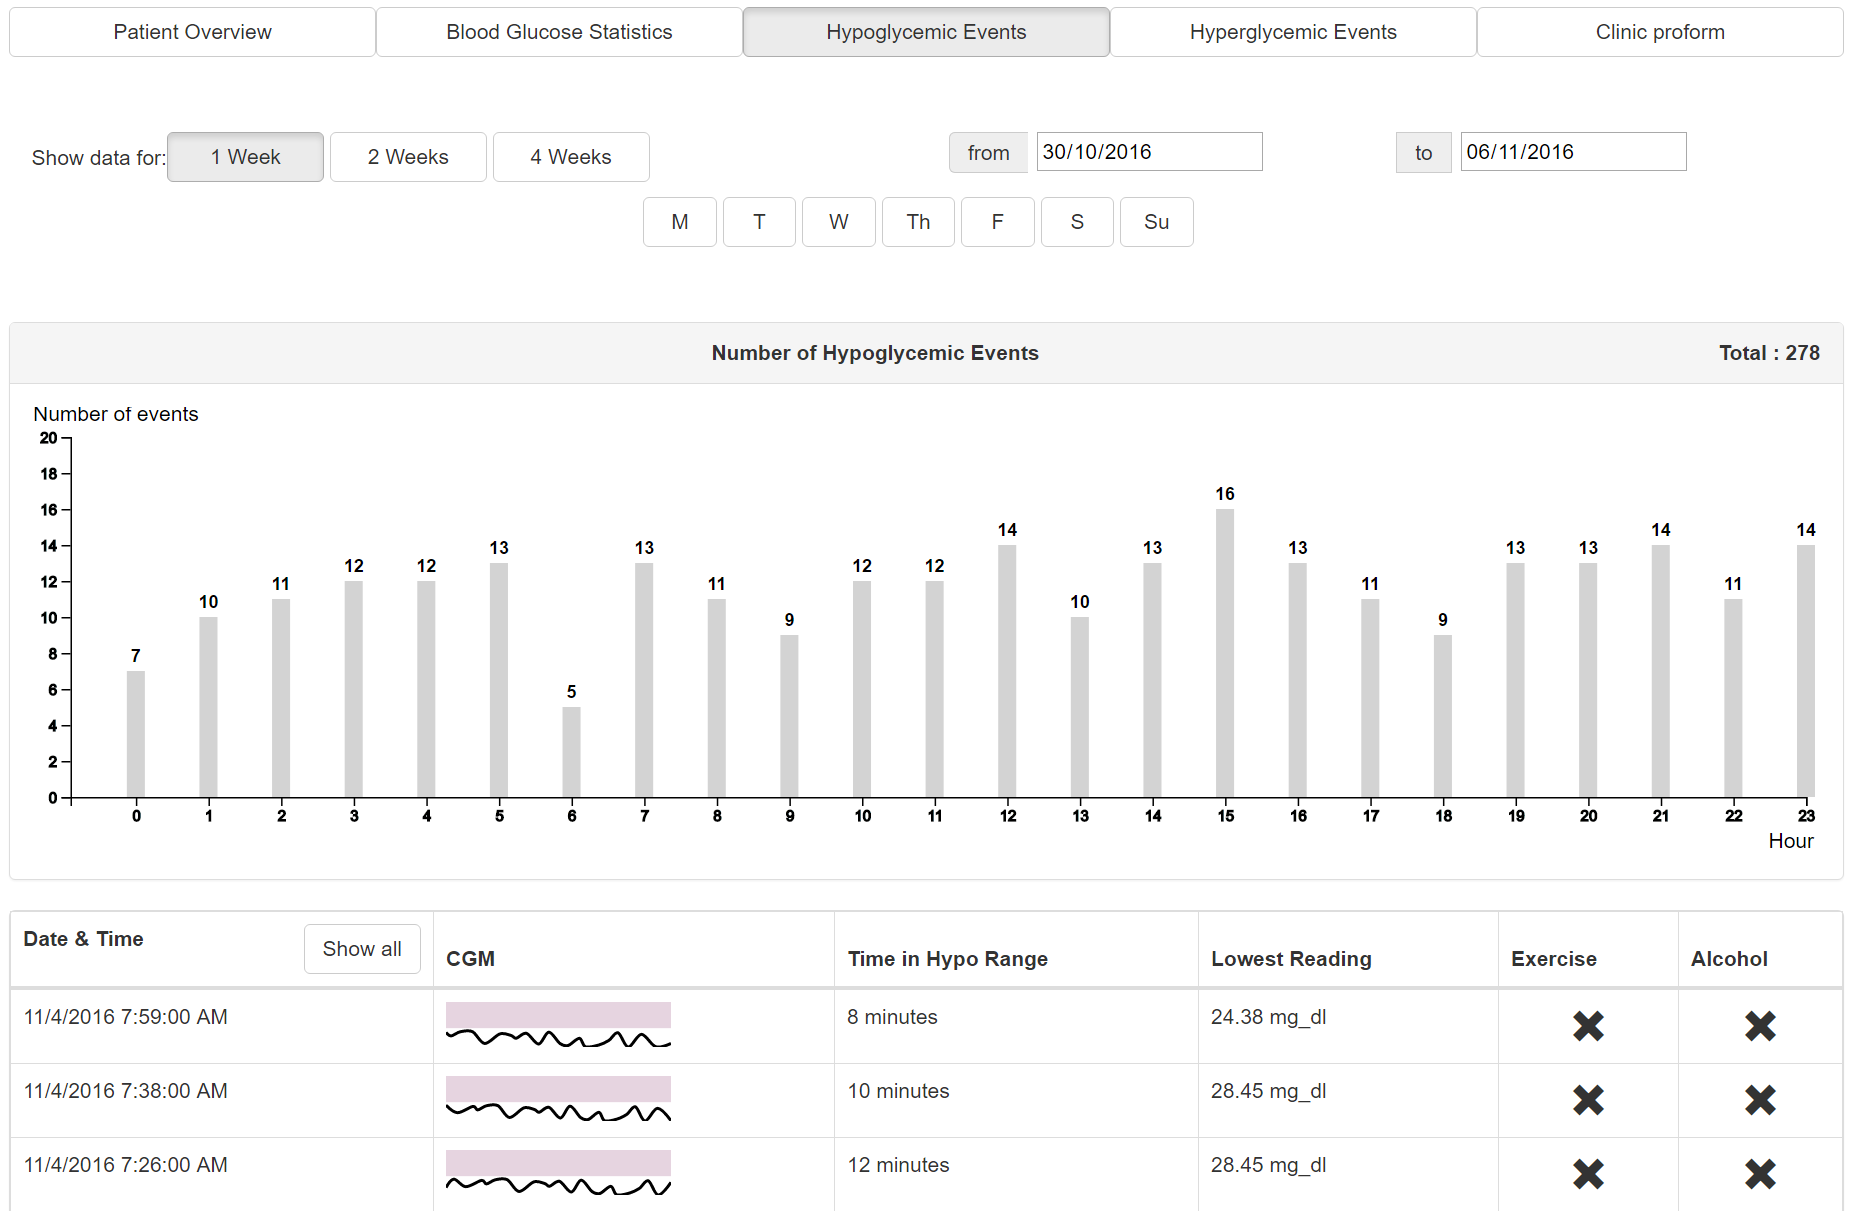
3.4.3.3 Hypoglycaemic Events
Indented use: To identify trends and causes of hypoglycaemic events through data exploration.
The hypoglycaemic events page (Figure 9) is used to provide quick access and visualisations of all hypoglycaemic events for a defined period of time. The range of the data displayed can be changed by using the following filters:
- Show data for: 1, 2 or 4 weeks. Alternatively input a custom date range using the date pickers (Default: 1 week).
- Filter the days shown: Click the days Monday (M), Tuesday (T), Wednesday (W), Thursday (Th), Friday (F), Saturday (S), Sunday (Su) to limit what days the data should be shown for (Default: all days are shown).
The column chart shows the number of hypoglycaemic events detected in each hour of the day over the selected time period.
Beneath the bar chart is a list of hypoglycaemic episodes. Each episode contains a Sparkline (small line graph) showing the CGM data for the episode. There is a grey bar across the Sparkline, this denotes the target range of the patient. By default, the list of episodes is the most recent. This list can be expanded, or filtered to a specific hour by clicking a bar on the chart above.
Additional information is presented in the table such as time in hypoglycaemic range, lowest reading and various factors recorded during that period.
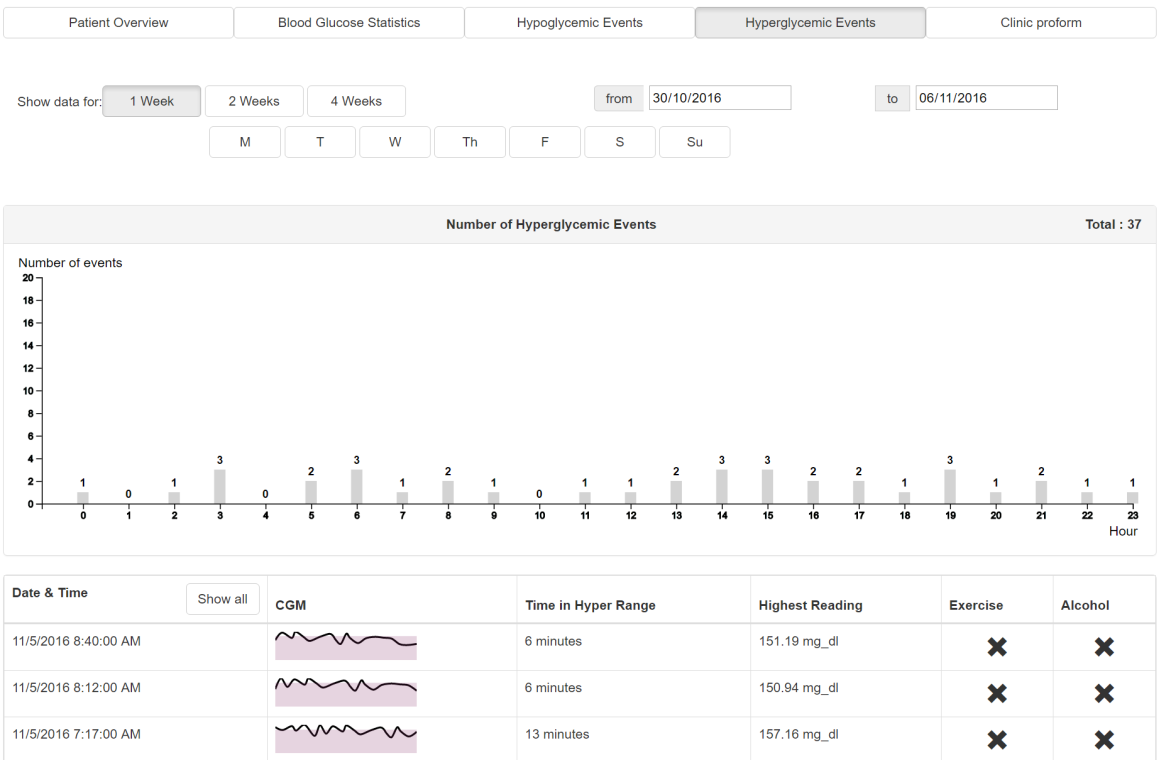
3.4.3.4 Hyperglycaemic Events
Indented use: To identify trends and causes of hyperglycaemic events through data exploration.
The hyperglycaemic events page (Figure 10) is used to provide quick access and visualisations of all hyperglycaemic events for a defined period of time. The functionality mirrors that of Hypoglycaemic events (Section 3.4.3.3) for Hyperglycaemic events.
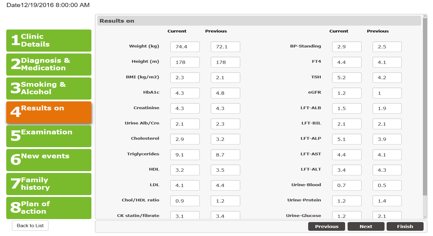
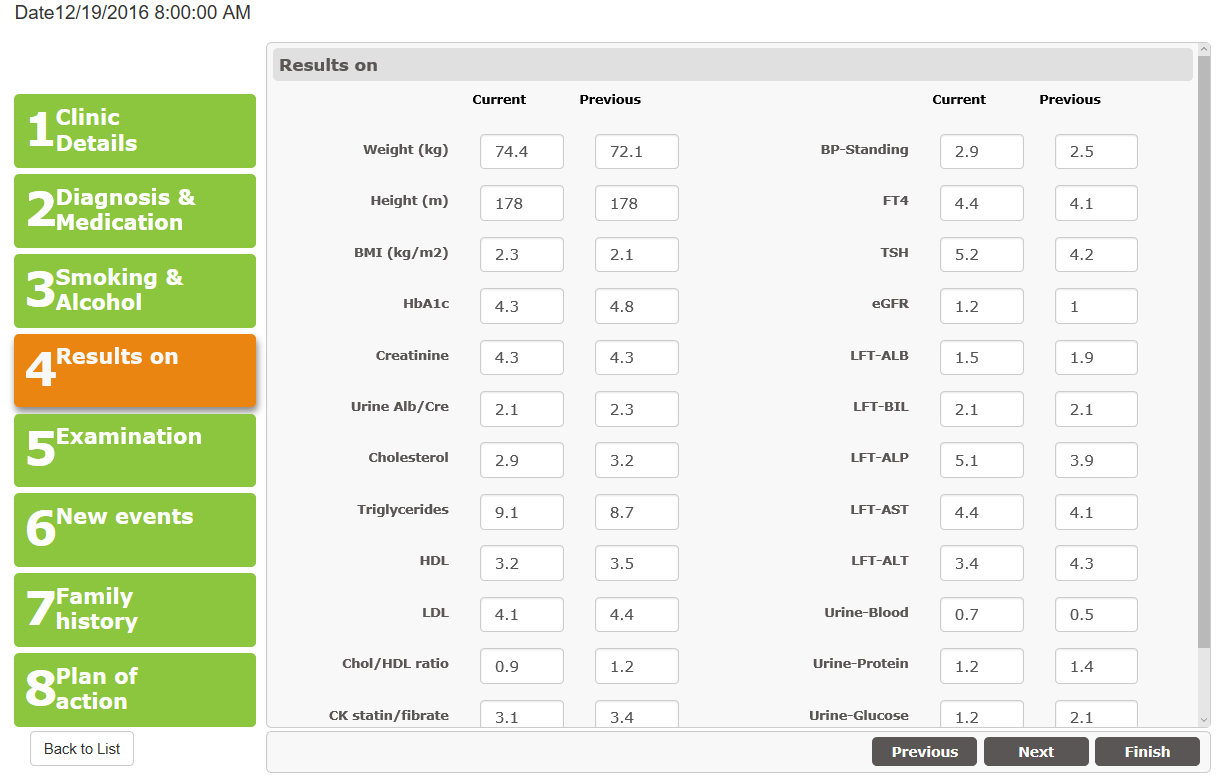
3.4.3.5 Clinic Proforma
Intended use: To record patient details from visit to visit, seeing progress throughout the study / use of the PEPPER system.
The purpose of the form is to record details of the patient throughout the trial. Where applicable, data from the previous clinic is displayed to allow comparison. Not every part of this form need be completed during every clinic visit and is at the discretion of the clinician, so fields are not be mandatory.
3.5 Case Base Reasoning Algorithm Integration
Intended use: To manage the patient case-base, allowing maintenance and approval the revision of cases.
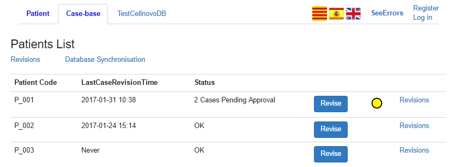
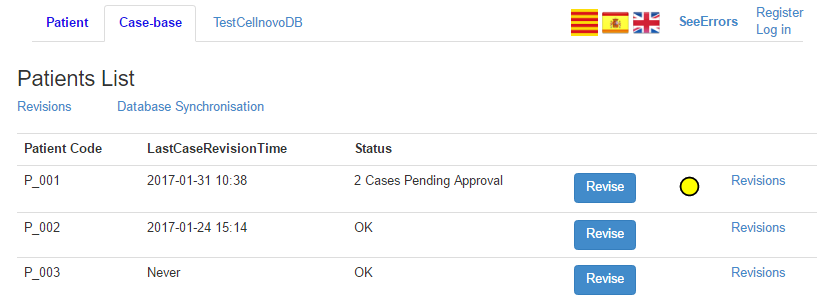
3.5.1 Patient List
The initial page for the case-base section of the PWI is a list of patients, stating the last case revision and number of pending cases, as shown in Figure 12. Yellow and red circles are included beside each patient to indicate urgency of any pending case revision. Selecting a patient from the list will show the patient’s cases pending revision (Section 3.5.2).
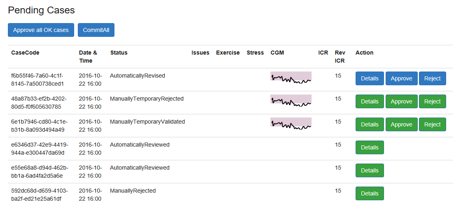
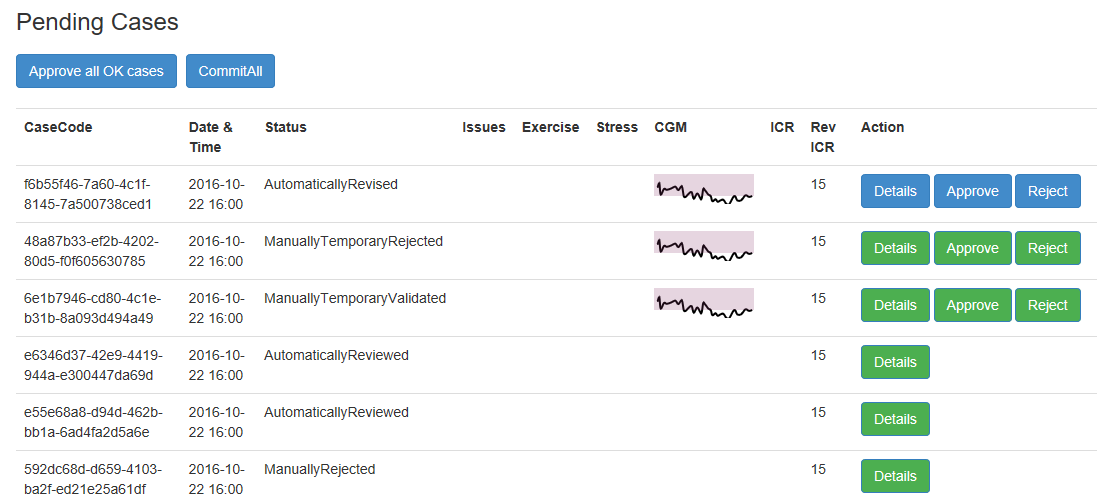
3.5.2 Patient’s Cases Pending Revision
Intended use: To display a list of pending cases for the clinician to retain for accepting or rejecting the new ICR value.
The pending cases screen presents a list of pending cases with details on the case parameters a sparkline showing the blood glucose levels recorded by the CGM and the target range, plus the originally used and automatically revised ICR value.
Pending cases can be view in more detail, approved or rejected. Selecting Details will display the detailed case revision interface, where the clinician can see more information about the case (Section 3.5.3).
To simplify the revision process. The clinician can click ‘Approve all OK cases’ at the top left of the screen, and then commit the cases. In cases where there is significant or important CGM data loss (e.g. just after a meal or longer than 30 minutes) then automated revision is not permitted.
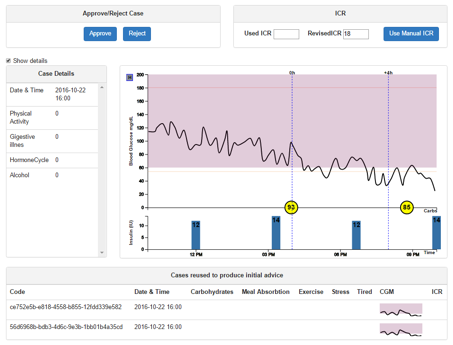
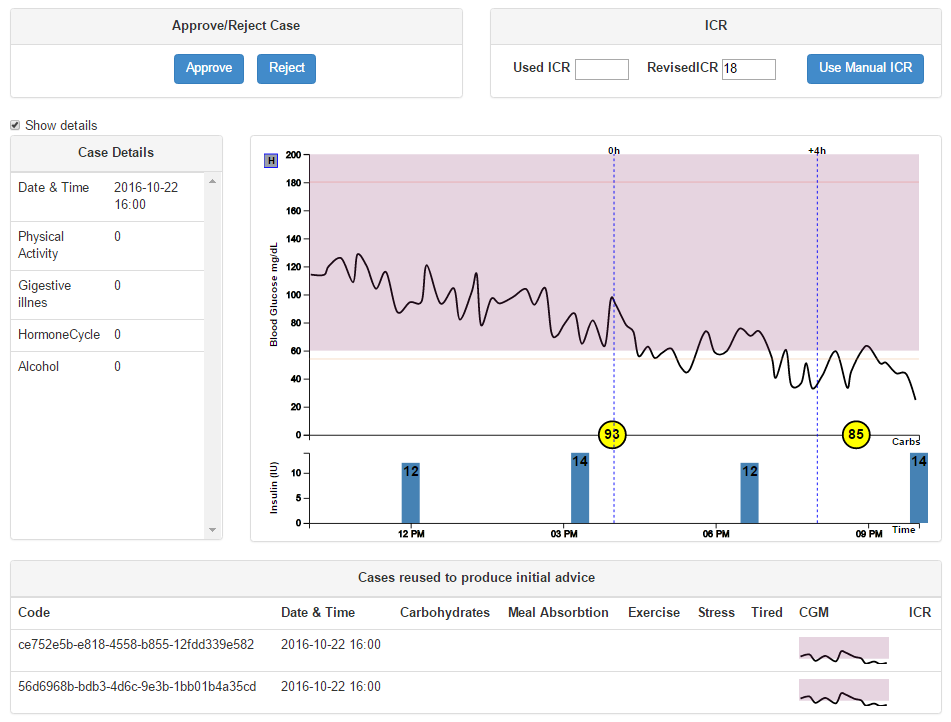
3.5.3 Case Details
Intended use: To facilitate case approval or rejection of the revised ICR by providing more details about the case in question.
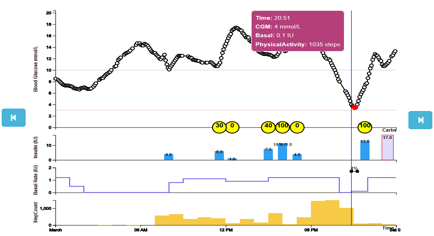
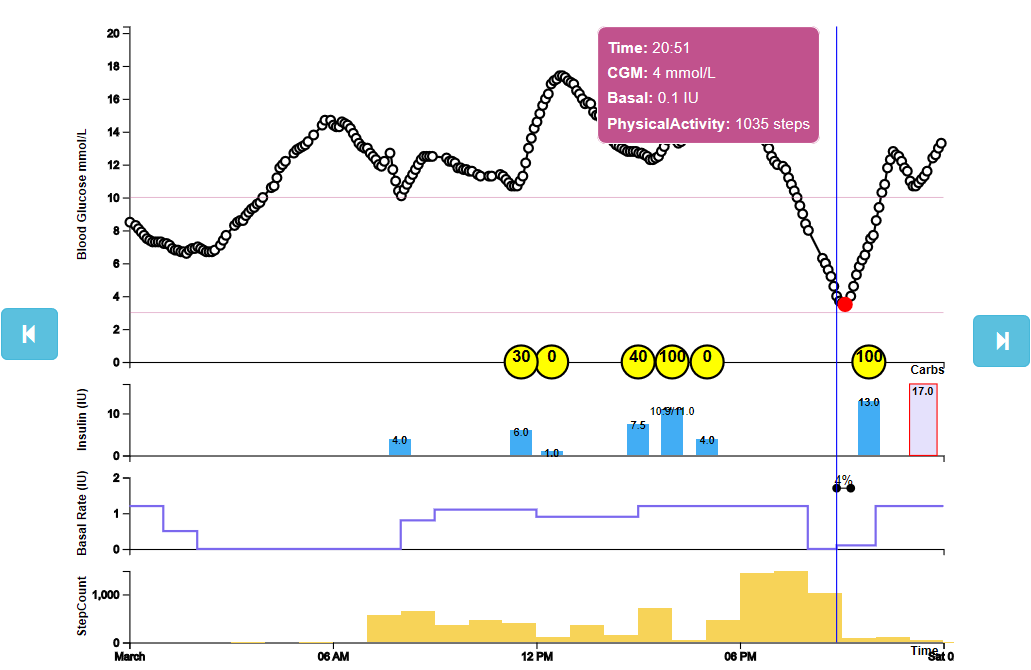
The ‘details’ option on the pending list allows a detailed view of a case pending revision to be seen. The page contains all the PEPPER case parameters displayed as text and is accompanied by the visualisation showing the CGM data, carbohydrate intake, bolus and basal (for CSII patients).
At the bottom of the page is a list of the cases reused to produce the suggested ICR and ISF values when bolus advice was obtained. A reused case can be clicked to display a detailed view of the case alongside the current case being revised.
From this interface, the clinician can approve or reject the case by selecting the appropriate option at the top left of the interface.
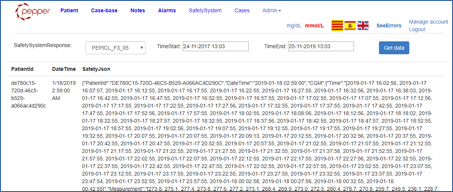
4 Safety System API integration
The Safety System API sends Safety System Objects (SSO) to backend database by using the web services. The SSO objects are encapsulated into JSON objects and include the main patient data for that SSO time:
- Patient Id
- Date Time
- CGM data
- Derivatives
- Forecasted
- Glucose Alerts
- Bolus
- GlucoseAlarms
- SafetyLowGlucoseSuspend
- Etc.
For more info about Safety System API and objects please read the related section from this site. The PWI reads SSO objects from database and displays the included data. The figure below shows the SSO (JSON format) data for a selected patient and a selected time interval:
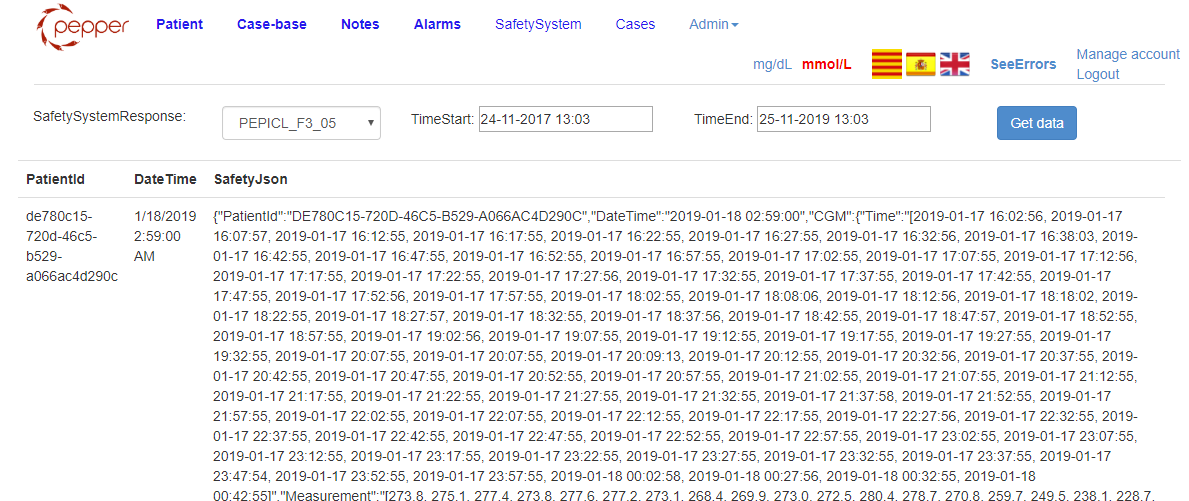
5 Notes
Intended use: To collect general notes and feedback from the study participants for the purpose of the usability study and general issues with the system.
The notes interface (Figure 16) displays a small note submitted by the patient from their PEPPER Mobile Application. The information is accompanied by a timestamp and patient code to facilitate data analysis. The clinician/researcher can search the notes list for notes submitted by specific patient codes.
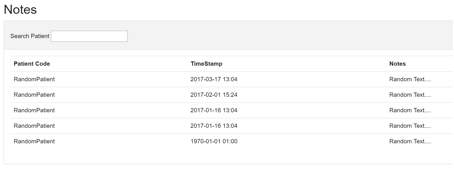
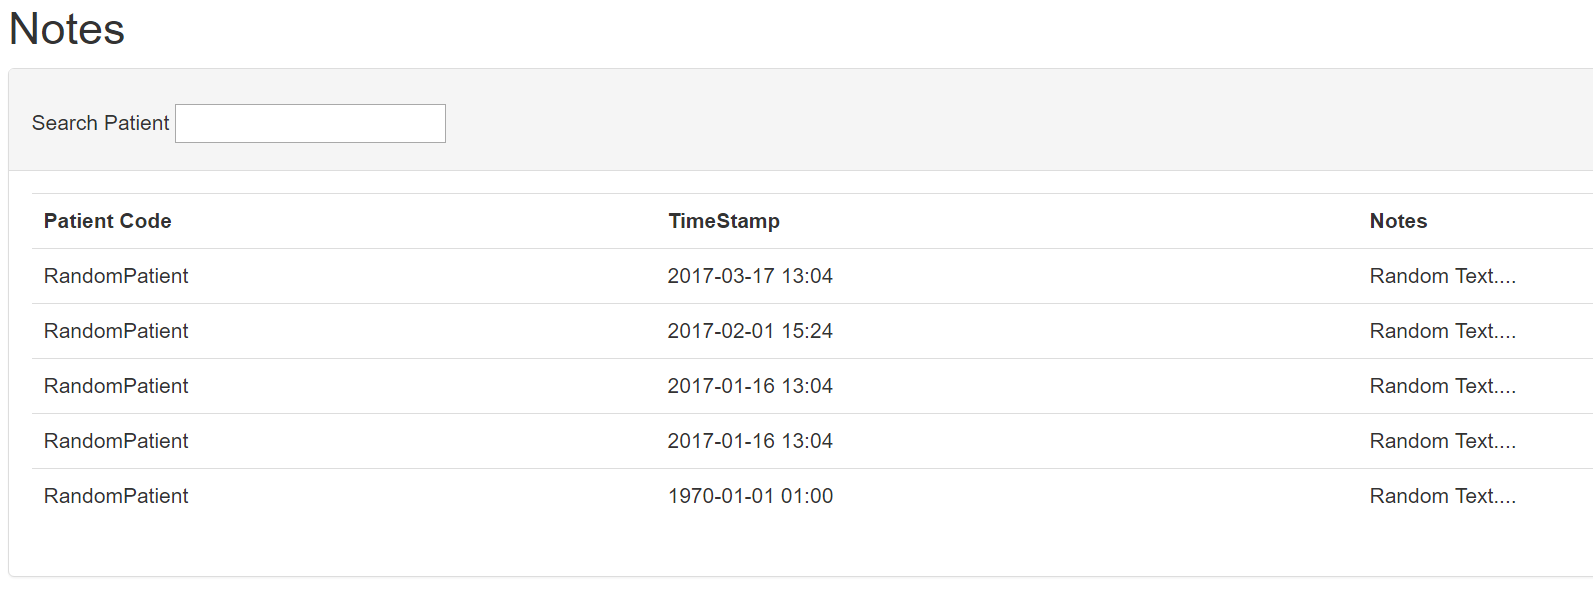
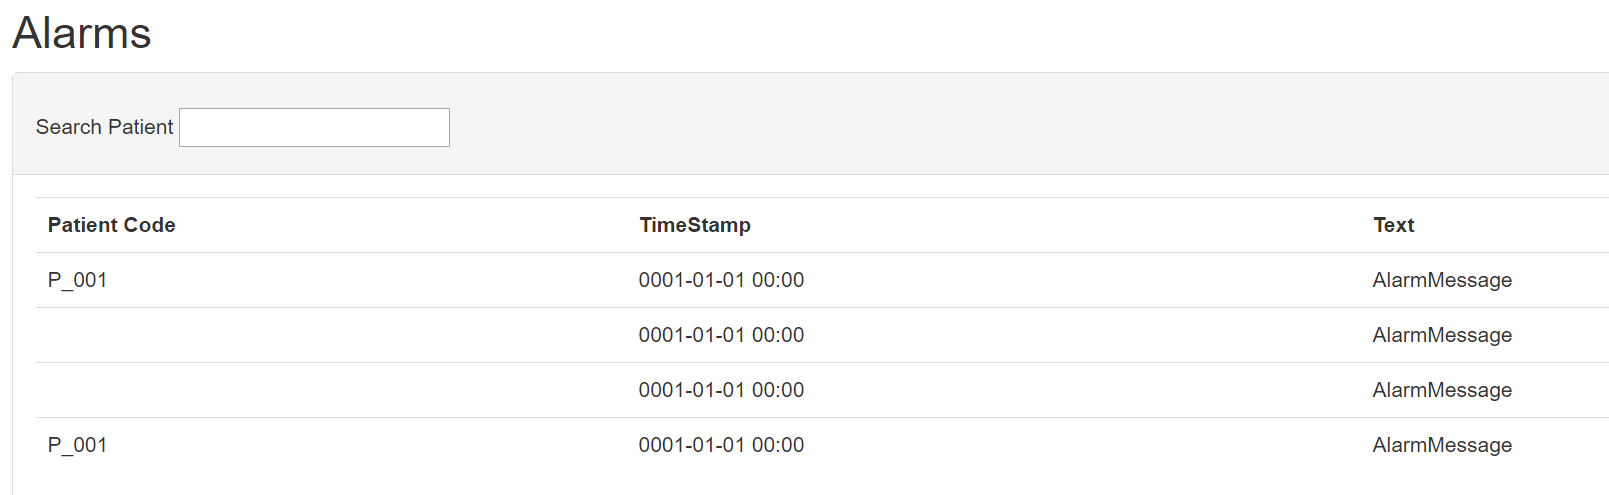
6 Alarms
Intended use: To collect alarm occurrences from the study participants for the purpose of data analysis.
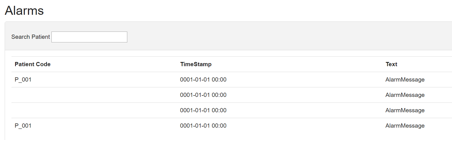
The alarm interface (Figure 17) displays details of alarms occurring on the patient’s handset that occur from their PEPPER Mobile Application. The information is accompanied by a timestamp and patient code to facilitate data analysis.
The clinician/researcher can search the alarms list for notes submitted by specific patient codes.
7 Data Analysing
The PWI application includes a page for glycaemic data analysing:
- Read glycaemic patient data (CGM values, meals, insulin injections, physical activities etc.) from the backend database.
- Displays in a graphical manner all these values, helping the patient and the clinician to analyse the CGM curve associated with other patient events: meals, insulin injections, physical activities.