PEPPERDashboard
Author: Alex Russell (Oxford Brookes University)
This API provides an implementation of the Graphical User Interface for the PEPPER Mobile Application PEPPERDashboard. It relies on the PEPPERChart charting library, which is also accompanied by a detailed wiki and associated Javadoc.
The PEPPERDashboard API replicates the handset GUI that was used in the PEPPER Mobile Application within the clinically evaluated PEPPER system. The original interface was implemented by Cellnovo Ltd., which was an former partner in the project. The version of the GUI provided by this API has been developed independently by OBU, who designed the original interface in consultation with patients and clinicians [1,2].
This code provides an architecture for the dynamic data visualizations used in the PEPPER application, which can be updated as new data is generated. The visualization designs can also be easily modified with minimal disruption to the business logic of the app.
This is achieved through the separation of concerns in the ModelView-ViewModel design pattern. In this framework, the DataModel supplies data from the app’s data structures to the visualization module. The ViewModel takes data from the DataModel and formats it so that it can be used by the View. Lastly, the View component presents the data on the screen. It relies on PEPPERChart (a custom-built SVG charting library for Android) to load the visualization as a webpage into an Android WebView.
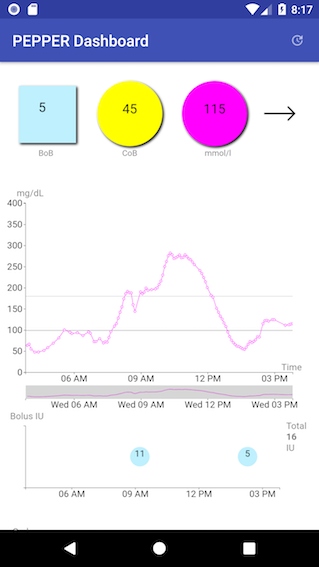
The resulting dashboard screen looks like this:
The code here has two components (other than the charting library mentioned above).
- The pepperdashboard module. This creates a visualization for the PEPPER app’s dashboard display using the MVVM architecture. The module has been designed so that it may be easily integrated into a future version of the app.
- The Android app itself is a test implementation of the dashboard module. To demonstrate how the implementation might be carried out, the test implementation uses real, anonymized, data.
A diagram of the relationship of the key classes is shown below:
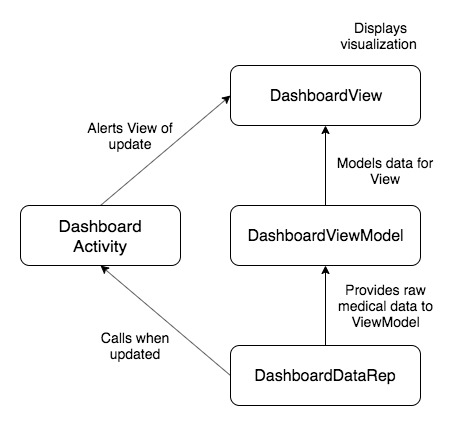
In the code found here, the View and ViewModel are part of the pepperdashboard module. This module could be integrated into a version of the app 'as is'. In the main app code the DashboardDataRep mocks a real data repository provided by the business logic of the app, and the DashboardActivity mocks the Activity controlling the dashboard visualization.
References
- Clare Martin, Arantza Aldea, David Duce, Rachel Harrison, and Bedour Alshaigy. The Role of Usability Engineering in the Development of an Intelligent Decision Support System. Artificial Intelligence in Health 2019 P142-161. First International Workshop, AIH 2018, Stockholm, Sweden, July 13-14, 2018, Revised Selected Papers. Springer Lecture Notes in Artificial Intelligence Vol 11326
- Clare Martin, David Duce, Daniel Brown, Arantza Aldea,Bedour Alshaigy, Rachel Harrison, Alex Russell, Marion Waite, Mercedes Fernández-Balsells, José Manuel Fernández-Real, Yenny Leal, Marzena Wos, Lucian Nita, Beatriz López, Joaquim Massana, Parizad Avari, Pau Herrero, Narvada Jugnee, Nick Oliver, Monika Reddy. Reflections on the design and evaluation of a medical mobile interface. (2020) Submitted to BCS Interactions.